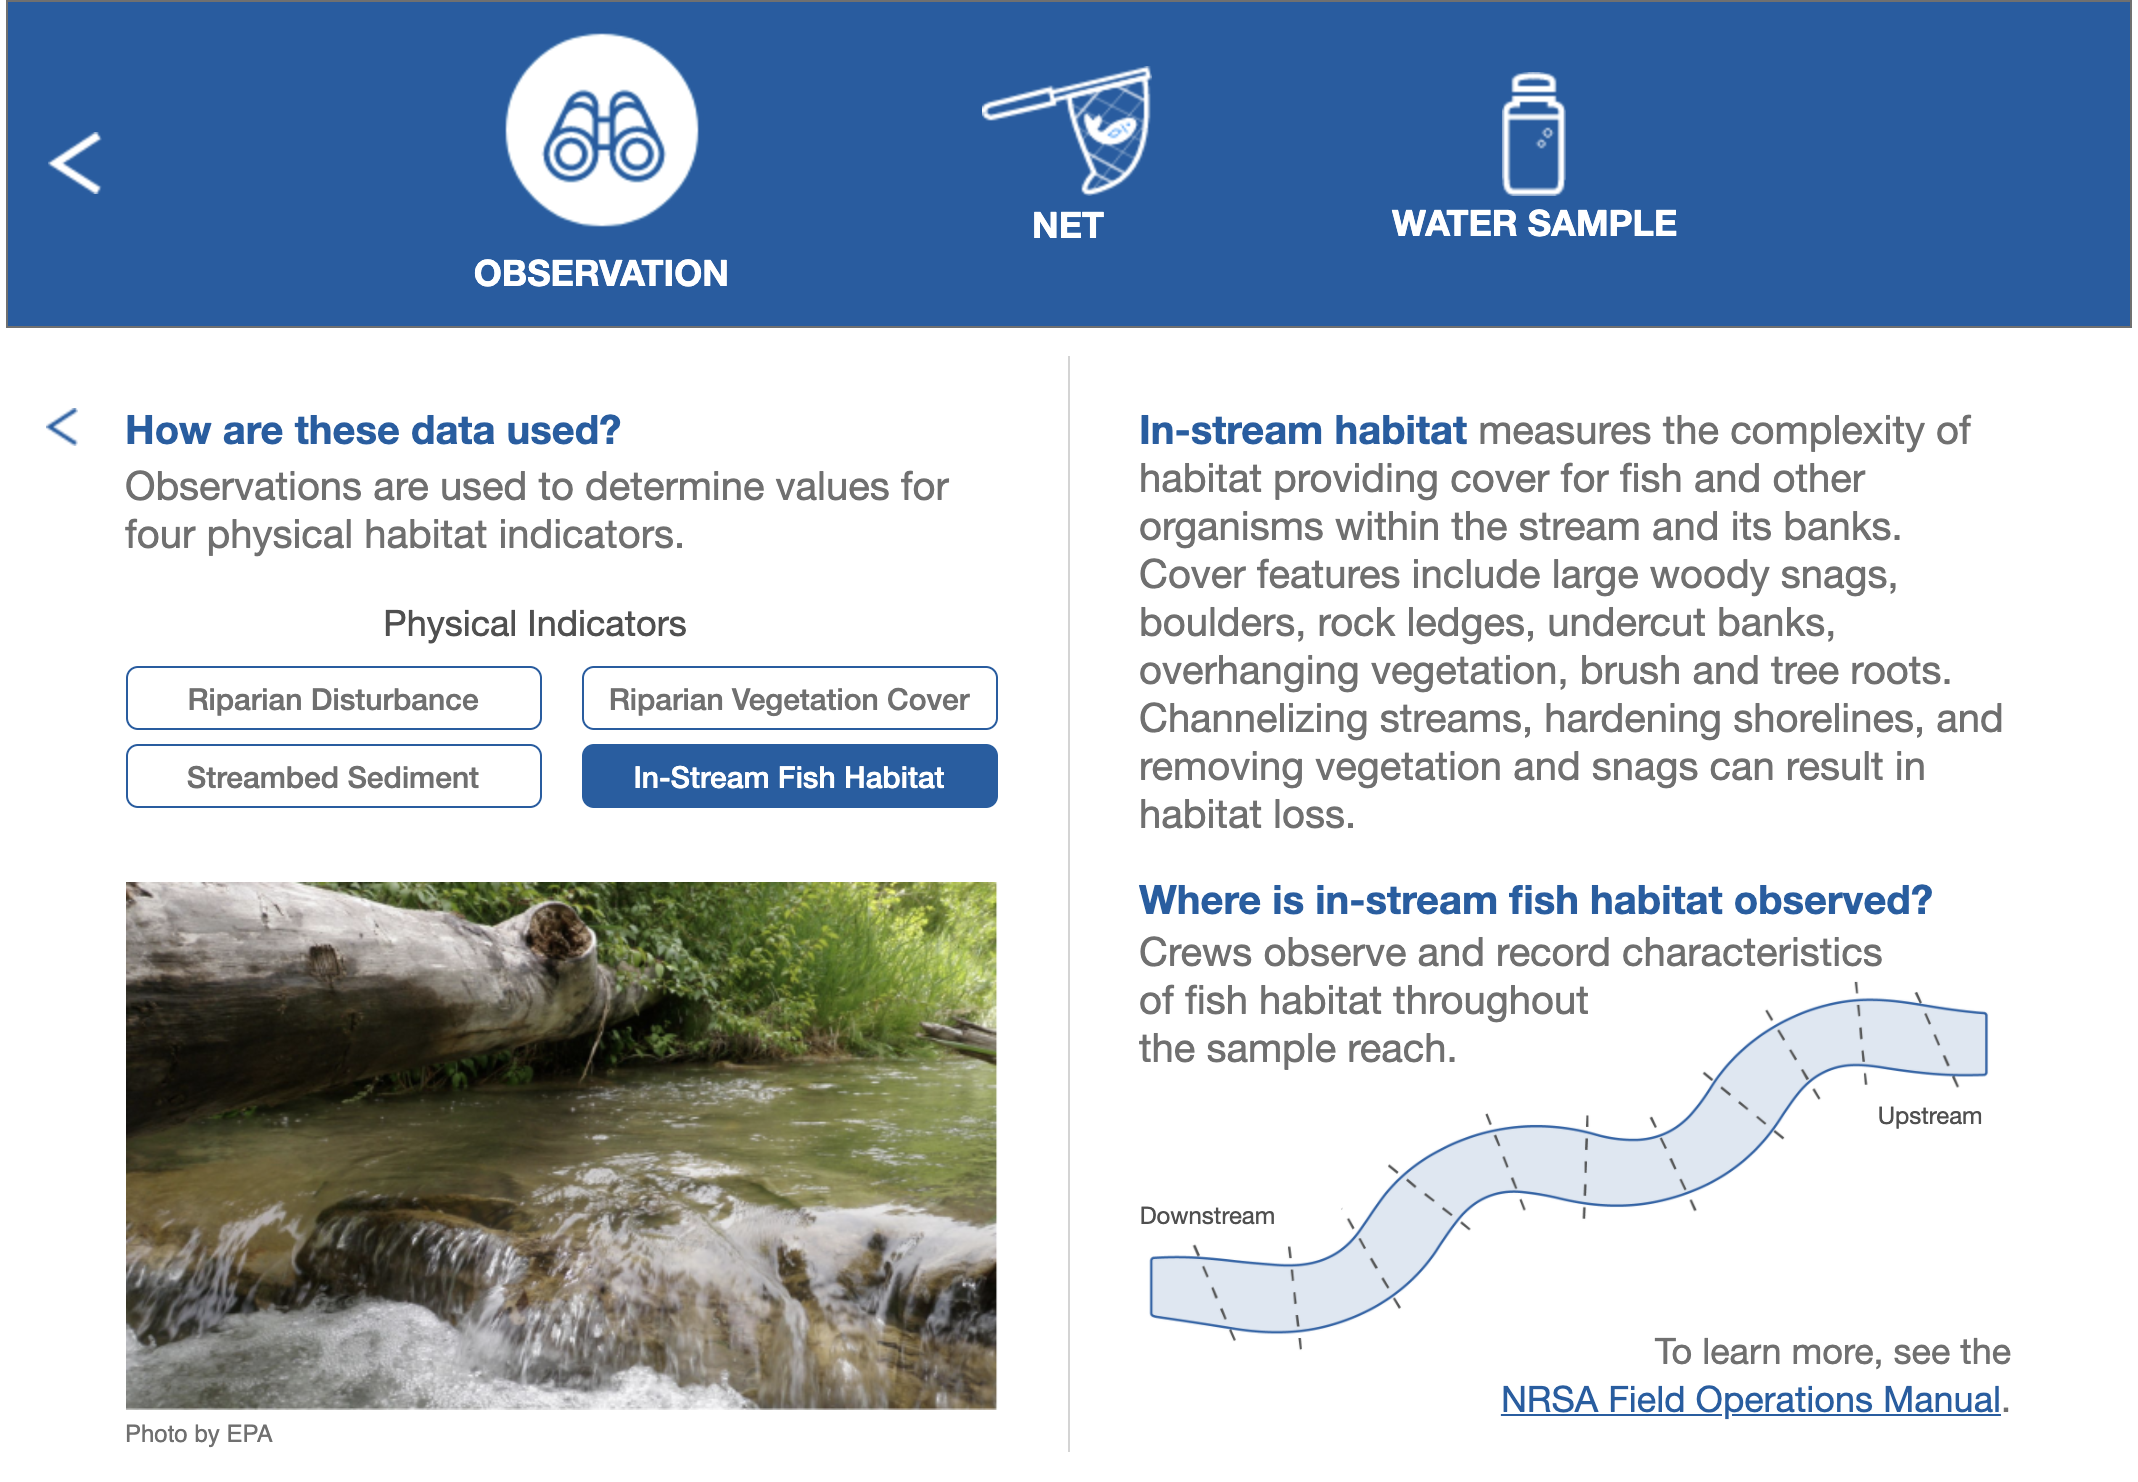
What Happens on a Field Day? Web Story

EPA’s Office of Water wanted a new way to explain its survey methodology to a lay audience. Understanding survey context can lead to greater understanding of the resulting data. Based on an explanatory graphic we created for the full-length National River and Streams Assessment report, we designed a simple website to explain each environmental indicator used in the report, preparing custom illustrations and collaborating with EPA to craft clear text.