What's the Risk? Using Data to Target Interventions
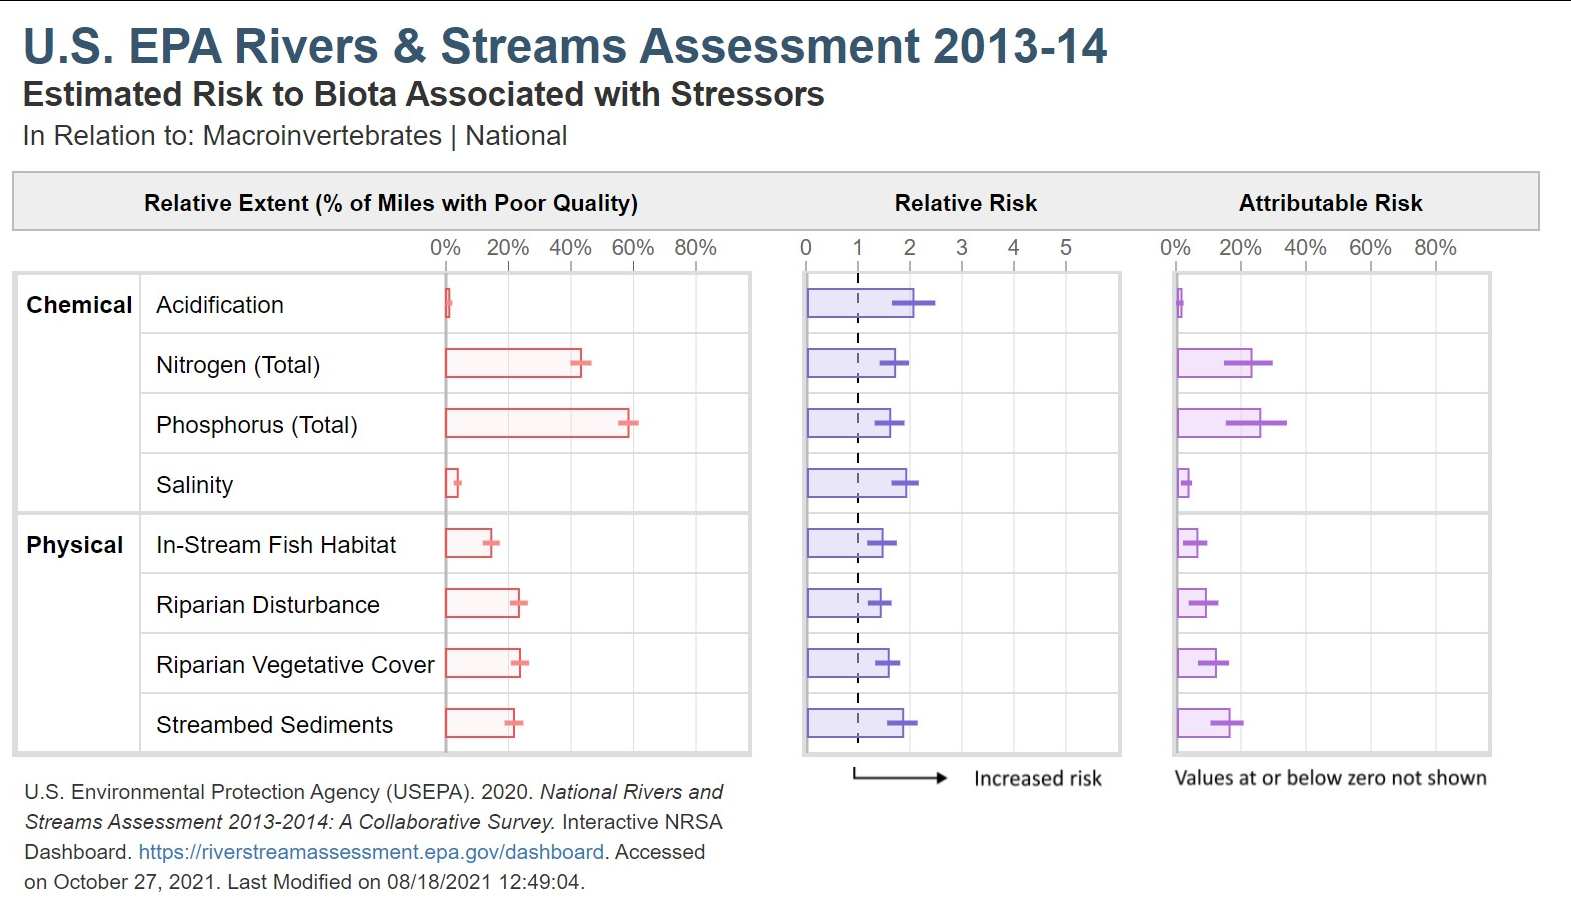
For U.S. EPA’s Office of Water’s National Rivers and Streams Assessment, we built upon earlier survey dashboards to develop a view showing how likely it is that various environmental conditions will affect stream ecology. The risk dashboard, developed using using JavaScript and D3.js, illustrated the extent to which ecology could improve as conditions improve. Risk data can help watershed managers prioritize programs that address specific pollutants or problems. For the report accompanying the dashboard, Crow Insight also developed an explanatory graphic that described how to interpret the risk graph used in the dashboard. Crow Insight has also helped EPA with reporting and methodological explanations for the assessment.