How’s Our Driving? Survey Data, Re-Imagined
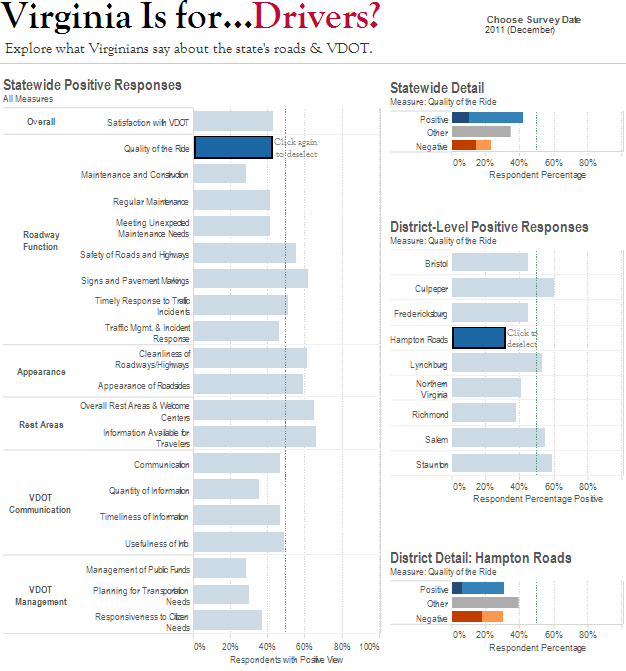
Crow Insight helped the Virginia Department of Transportation (VDOT) re-imagine its web-based dashboard for sharing data from a citizen satisfaction survey. The new dashboard played on a familiar Virginia slogan designed to attract users and allowed comparison of multiple measures simultaneously. It focused on positive responses but let users drill down to discover more response data and regional differences. VDOT’s original dashboard had relied on poorly suited pie charts that weren’t accessible for color-blind users and on an unwieldy interface that discouraged interaction and pattern discovery.